Firstly, a tribute to BrettThis year we lost a towering figure in the weather and climate research community, Dr Brett Mullan. He was my boss and was in fact the first person I met here, since he picked me up from the airport on my arrival. This work is dedicated to his memory. 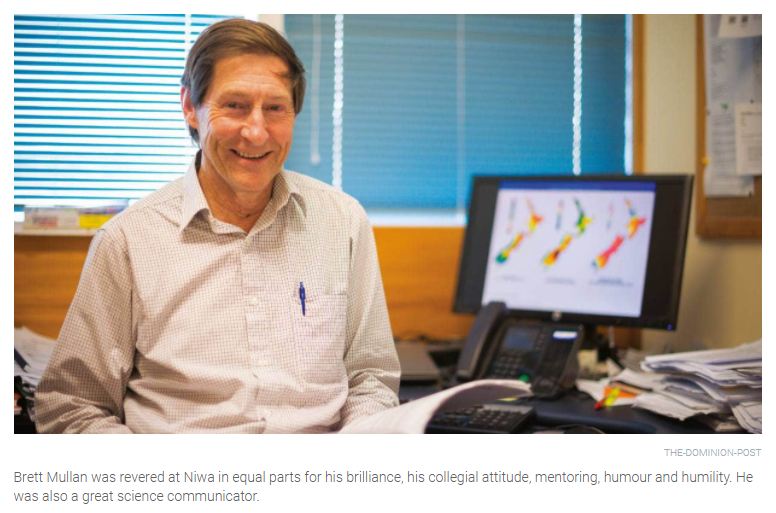 Image and caption from Brett's obituary by Susan Pepperell. Earth system modelling in the Deep South National Science ChallengeOne of the central deliverables of the Deep South National Science Challenge is the development of an earth system modelling capability to Aotearoa New Zealand. This model is now mature enough that its results are starting to appear in the peer-reviewed literature. There's also a recent blog post on the Deep South Challenge website about this from which I've taken the next image. 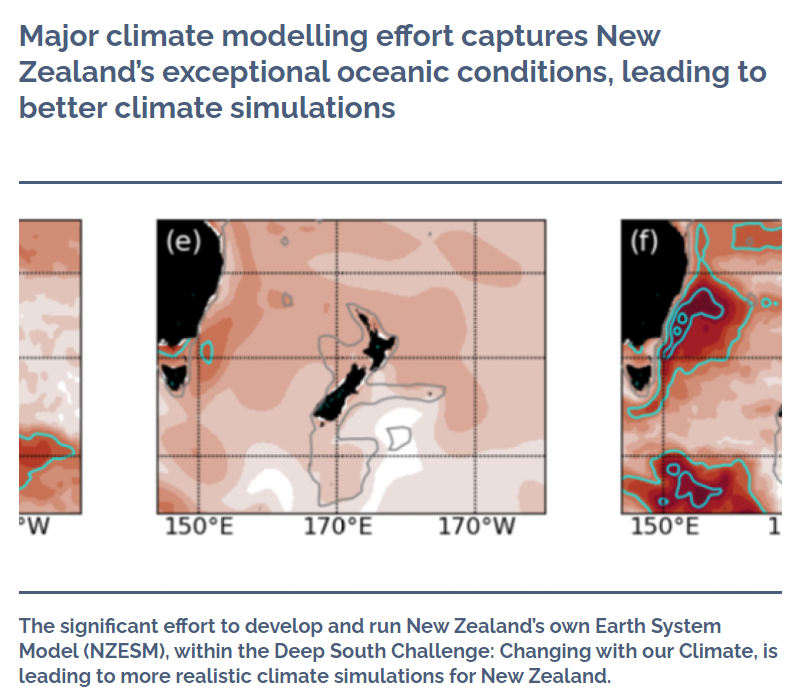 We are now at a very exciting stage in the model development where the global NZESM has produced 'hindcasts' from the mid 20th century up to 2015 as well as future climate change scenarios out to 2100. Clearly no one knows exactly what the future emissions pathways will look like and for this reason we have run 3 different future scenarios, which are shown here... 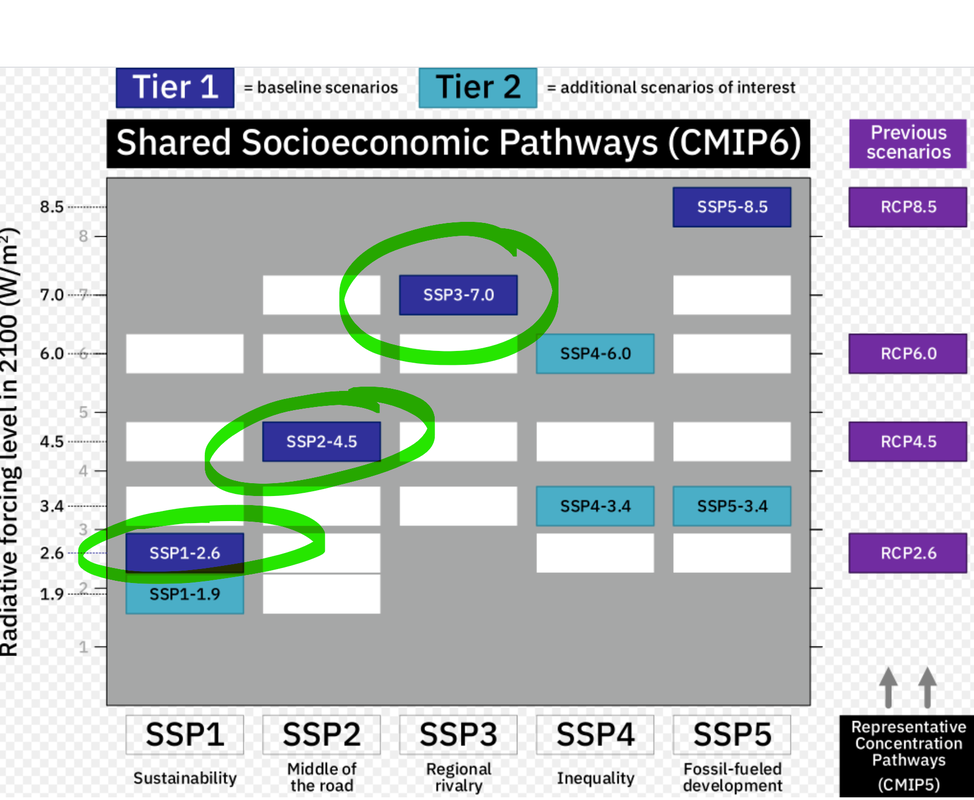 File:SSPs-CMIP6.svg. (2020, October 27). Wikimedia Commons, the free media repository. Retrieved 03:44, December 10, 2020 from https://commons.wikimedia.org/w/index.php?title=File:SSPs-CMIP6.svg&oldid=503215299. There are many of these scenarios and (for now) in this work we are only considering these 3. In their most basic forms: SSP1-2.6 is a low-emissions scenario, broadly consistent with the 'Paris Agreement' target of 2 degrees of warming; SSP2-4.5 is a medium emissions scenario and SSP3-7.0 models a high emissions (but not worst-case) future. Some of the aspects of the forcing of the model are illustrated here (from Meishausen et al.). 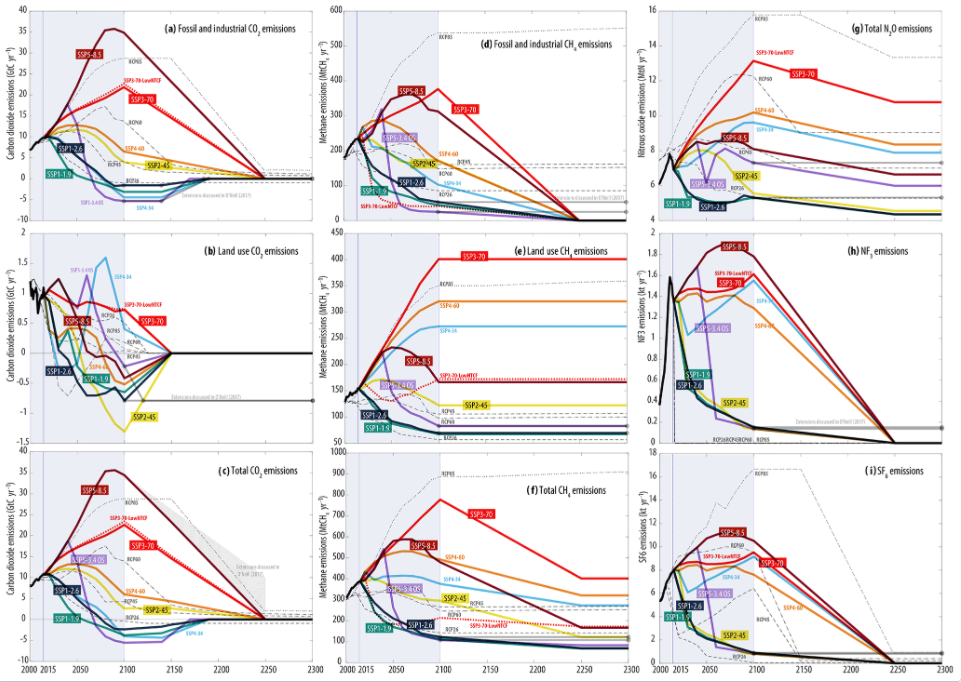 Since the NZESM is a global model, the resolution is fairly coarse. The next image shows the resolution of the global atmosphere component of the model. This shows air temperature near the surface and is clearly colder at the poles. Also note that the noisy coastline data is here is an artefact of the default options in the Ncview software used to (quickly) produce this figure! Incidentally, Ncview is free and brilliant for 'quick hacks' and producing animated gifs (using 'ncview -frames myfile.nc' and 'convert *.png mygif.gif'). 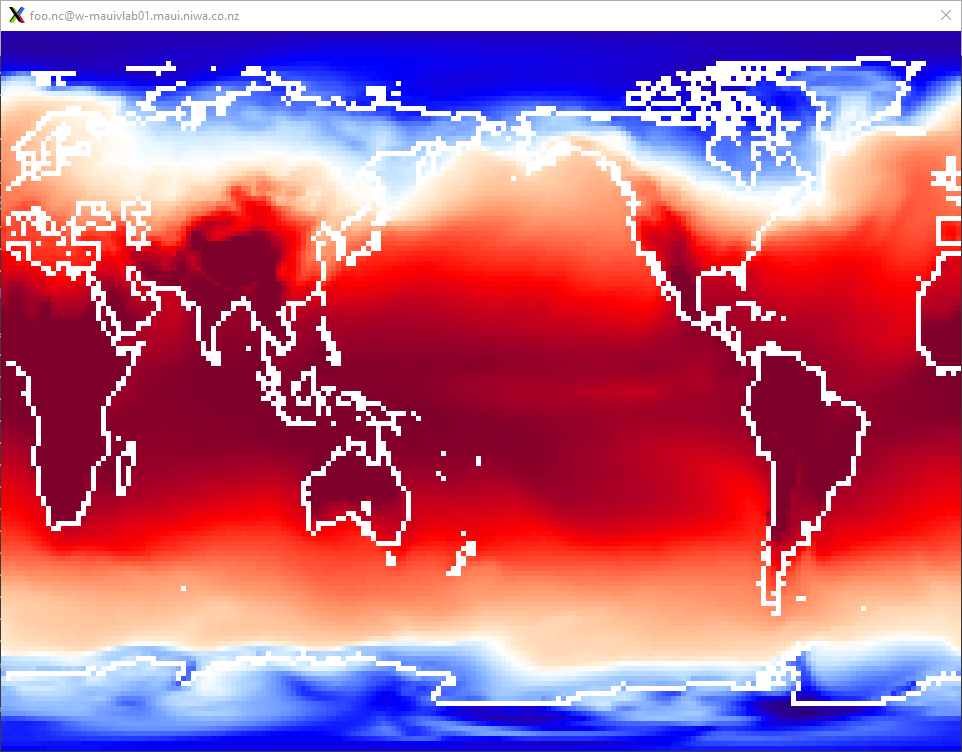 This figure is at the grid scale, which means that it is not smoothed. Now on a global scale this is fine, but if we zoom in to New Zealand...  ... we can see that the resolution is way too 'rough' to provide any meaningful regional information in a New Zealand context (again noting that the coastline data is an artefact; I just wanted to show the grid resolution). For example, in this resolution, Wellington, Nelson and Palmerston North would all be in the same or immediately neighbouring gridboxes. In the NZESM, as well as an atmosphere model, we have ocean, sea ice, ocean biogeochemistry and atmospheric chemistry too, all of which are able to change over time. In these senses, the NZESM is pretty much identical to its parent model, the UKESM. However, there are two main ways that the NZESM differs from the UKESM. Firstly it includes a solar cycle dependence of photolysis in the atmosphere and secondly, its major departure is the inclusion of a nested high resolution ocean model in the New Zealand region, as illustrated in Behrens at al., and here. 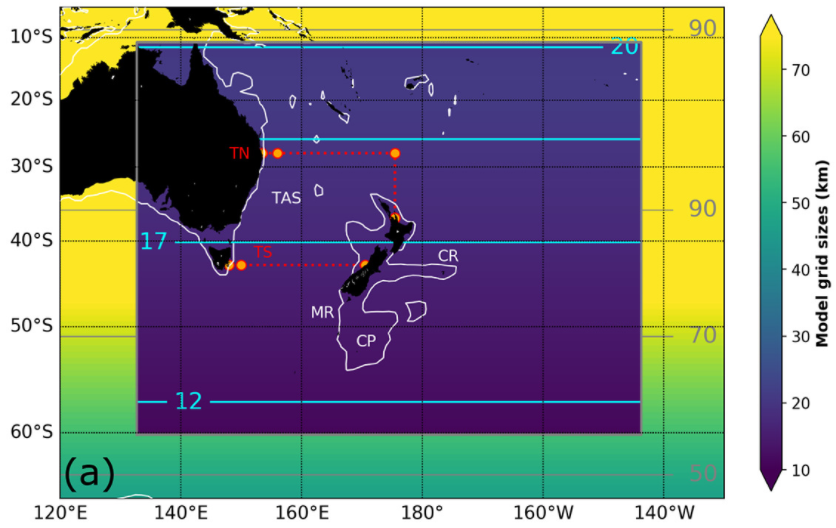 This big increase in ocean model resolution allows us to resolve eddies in the ocean which are not present in the global, lower resolution model. This image shows the sea surface height field of the ocean model in the two resolutions, just to show the gridscale resolution.  Here's a nifty animation I made of the sea surface height field using Ncview. This shows the ocean eddies which are able to transport heat south more efficiently, particularly via the East Australian Current.  Here's a final image of the sea surface circulation speed (again at the grid scale!). 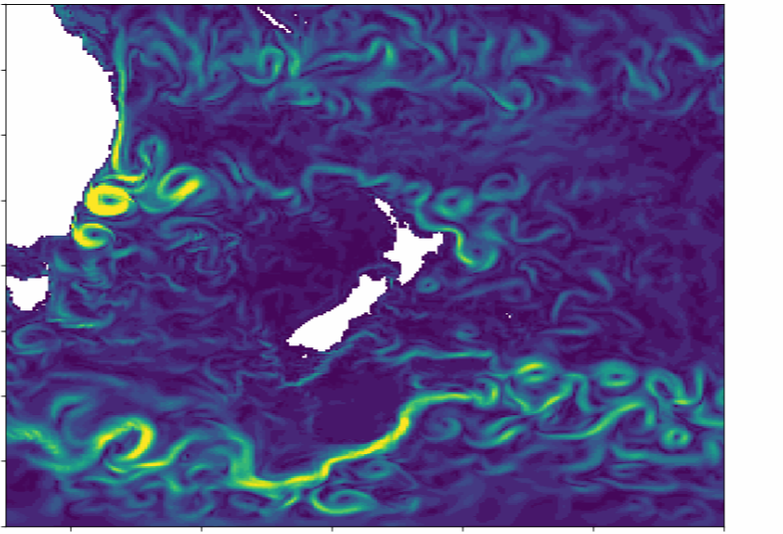 Because the atmosphere model in the NZESM is being forced from below by a higher resolution ocean, the atmospheric flows will be different.
We are currently performing a detailed analysis the output of the NZESM and the UKESM in detail to find out what differences the high resolution ocean around Aotearoa New Zealand predicts for our weather and climate in a changing world. We are also already generating data in a regional atmosphere climate model at 12km resolution, which is forced directly with raw data from the NZESM, and this in turn will feed into a catchment-scale hydrological model. Taken all together, this suite of work will provide global, national and regional scale climate and hydrological information to the scientific and policy-making communities in Aotearoa New Zealand. Watch this space!
0 Comments
Leave a Reply. |
AuthorThoughts on weather, climate, software dev, Python, open source and the like. Views are my own. 
Archives
March 2022
Categories
|
 RSS Feed
