|
I'm on Christmas annual leave now but just thought I'd write a very brief note on the single column model (SCM) which we will be running as part of the Deep South National Science Challenge. I managed to get the model to build and run yesterday, even if it did take me until 8pm to do so! I had previously got it running on our old IBM HPC but to get it running on our new platform is really exciting. We now have to work on producing our own input files; the example one we have from our collaborators at the UK Met Office is for the TOGA COARE (www.eol.ucar.edu/field_projects/toga-coare) field campaign. The SCM removes the horizontal processes of a full 3D AGCM (atmospheric general circulation model) enabling very fast run time and quick examination of parameterisation changes, for example. Here's an example paper on using the SCM... onlinelibrary.wiley.com/doi/10.1002/jgrd.50450/full I hope you all have a great Christmas break. Oh and by the way, this is the paper I was talking about! 
0 Comments
feature creation with matplotlib from scitools.org.uk
The full URL for this example is here... scitools.org.uk/cartopy/docs/latest/examples/feature_creation.html The image produced by this code is as follows. 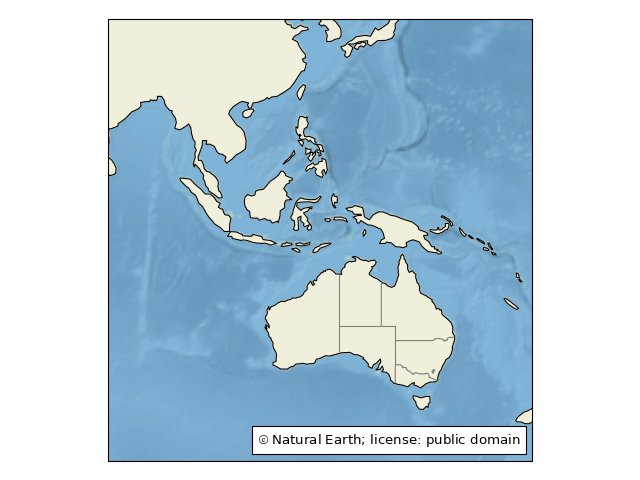 Although I've done a few invited (and not invited!) blog posts in the past I've never really had my own one so to speak. I'm off on my Christmas hols next in 3 days' time so I thought it might be a good time to start! Watch this space, let's see how this goes... This is where I love and work; Wellington, New Zealand and below is a screenshot of our current company homepage. Strictly speaking NIWA is a CRI or Crown Research Institute.  Anyway, that wasn't too painful. Thanks for reading this far!
|
AuthorThoughts on weather, climate, software dev, Python, open source and the like. Views are my own. 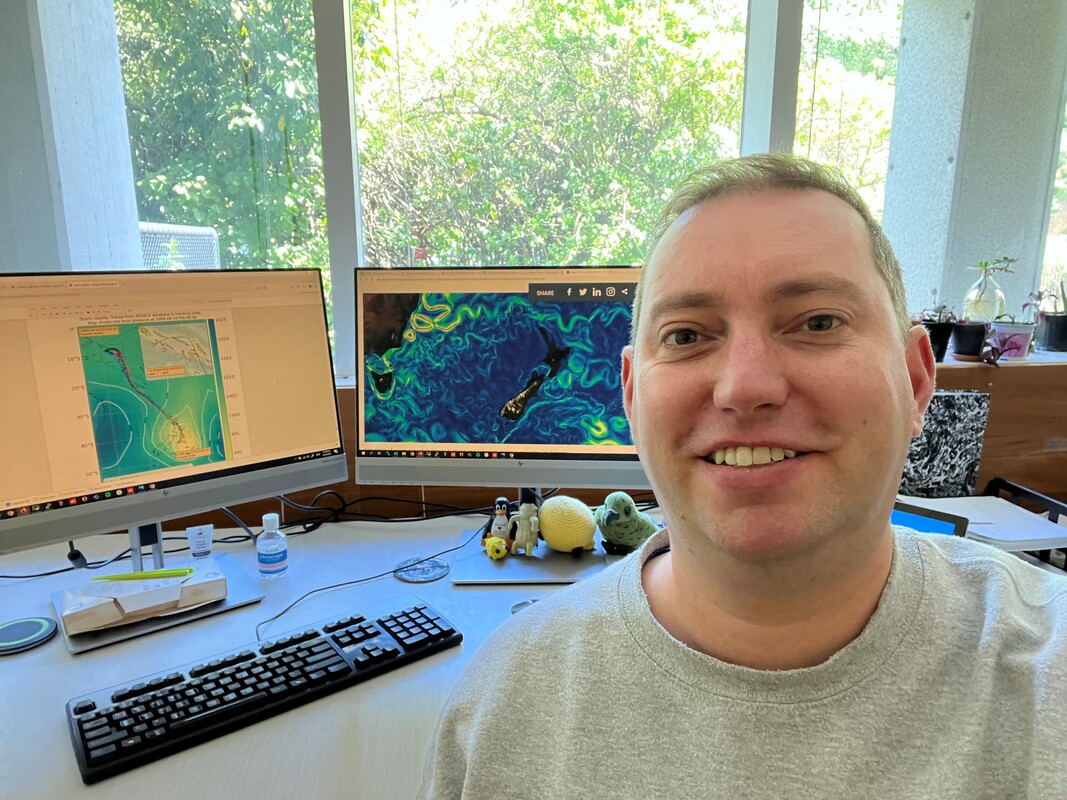
Archives
March 2022
Categories
|
 RSS Feed
