|
About 2 years ago I was discussing New Zealand climate with a way-more-senior-than-me colleague and they asked me about 'Kidson types' and to be honest I'd never heard of them. Now, if you ask most people about them, or read about them in recent papers, you'll be referred to this paper, which I'll call K2K from now on...  In (very) brief, the so-called Kidson types are 12 maps of 1000hPa geopotential height - basically the same as mean sea level pressure - which encapsulate the main weather types which New Zealand experiences. The next figure shows what they look like (replotted in Ackerley et al., 2011)... 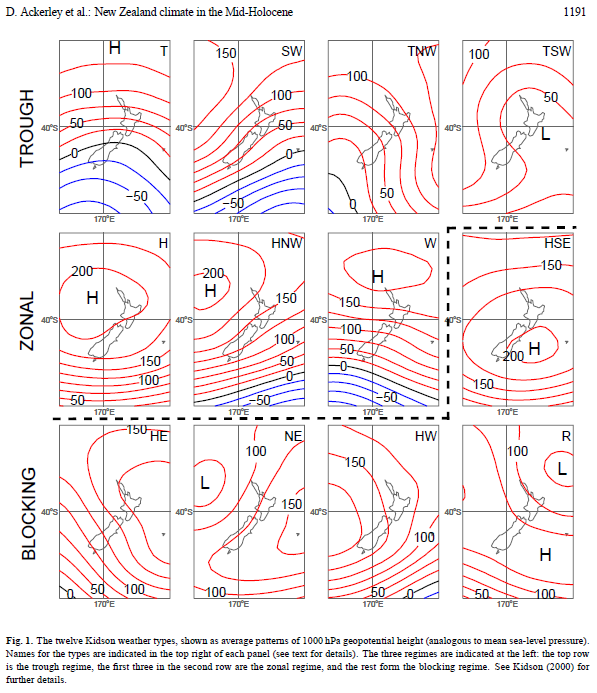 Now I don't intend to go too far into the precise scientific details of these types but you can get a good idea of the weather types associated with each of them by noting that - in the southern hemisphere - weather systems rotate clockwise round low pressure systems and anticlockwise around highs.  What I hope to achieve in this post is to illustrate that it's OK not to understand something and that it's OK to ask a lot of questions.  When I first read K2K, I was pretty baffled. It was the first paper I'd read on synoptic - think 'about 1000km in size'- weather types. This is normal for getting into any new area of science I know but there was one thing which really got me; how are the 12 weather types actually generated mathematically. One thing which was apparent to me from the wider literature was the following:
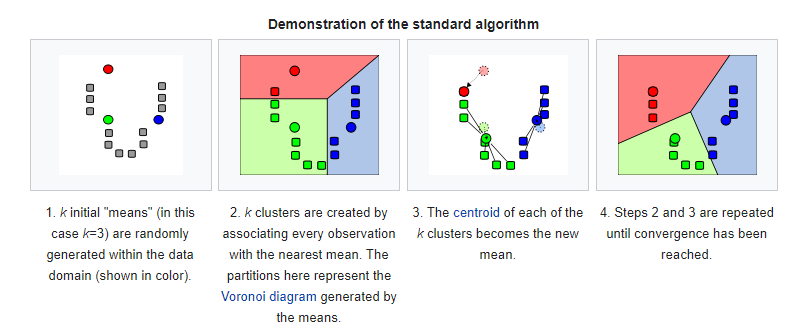
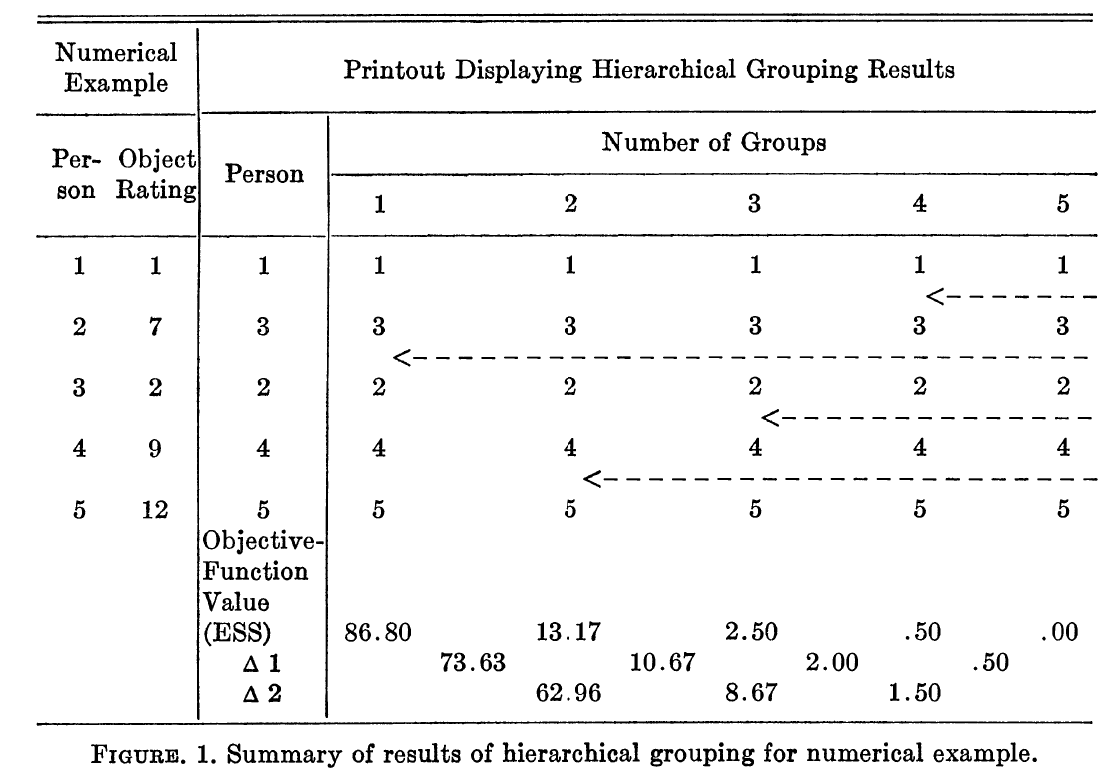 Aaaaaaaanyway, the point I'm trying to make here is that - yes OK - many people are familiar with clustering techniques but I wasn't, and trying to find out exactly how the maps above were generated was starting to drive me around the bend. At this point I was pointed in the direction of an online notebook by my Colleague Nicolas Fauchereau...  Along with a couple of helpful chats with another colleague (Drew Lorrey) on more general aspects of clustering techniques and their uses, advantages and limitations, this notebook gave me a massive step-up in getting to the bottom of my problem. However, Nicolas' notebook shows exactly the type of problem that I was coming up against; the K2K was not clear... 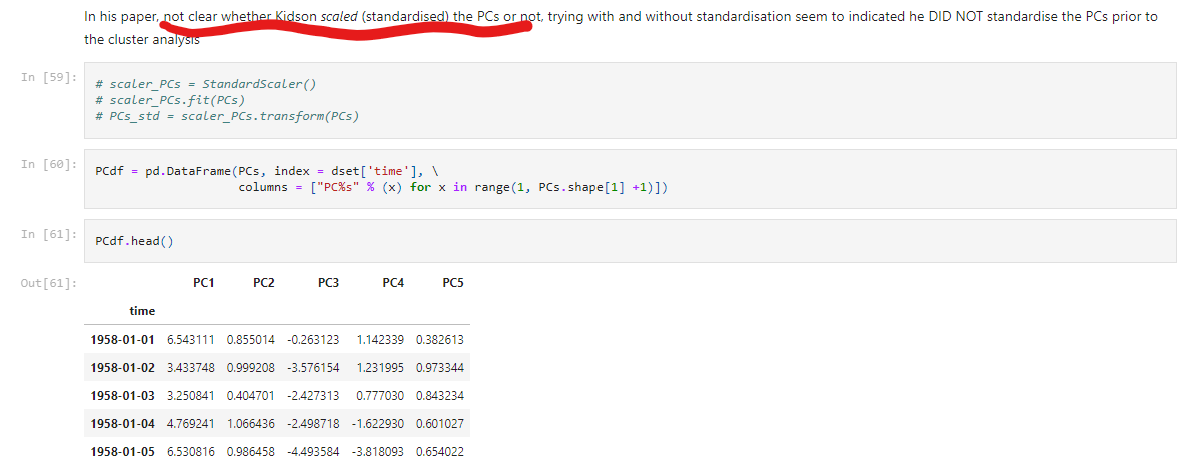 By this point, I knew that the basic procedure to generate the weather types was as follows:
 Luckily nowadays, there are Python packages for everything and from the notebook above I learnt about the scikit-learn package which can be used for the k-means clustering bit. Also, luckily for me as a user of the Iris package for working with geospatial data, there is the eofs package written to cater for the 'cubes' of data which Iris requires... 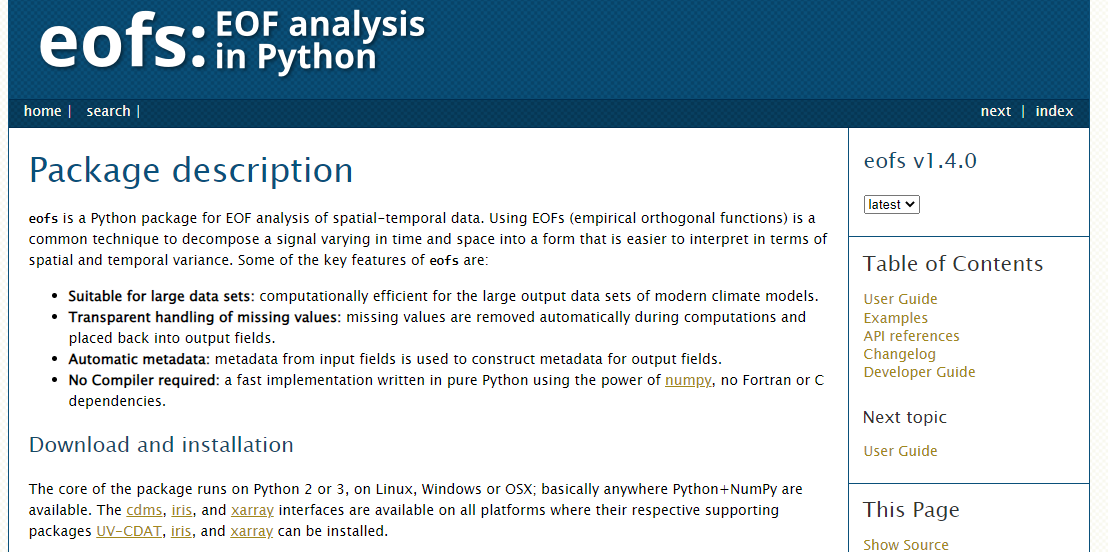 Now at this point, I was able to start my first proper task; to reproduce the Kidson types as obtained in K2K and plotted above. This proved to be significantly more challenging than I had anticipated. This was partly because of me being a noob in this field but also because the lack of detailed information on precisely how the types themselves were generated. At this point, James Renwick enters the story and after a couple of meetings and many emails, I finally managed to get my head around the problem at hand. We're lucky nowadays that online code repositories exist and I have put all my code relating this on my GitHub. 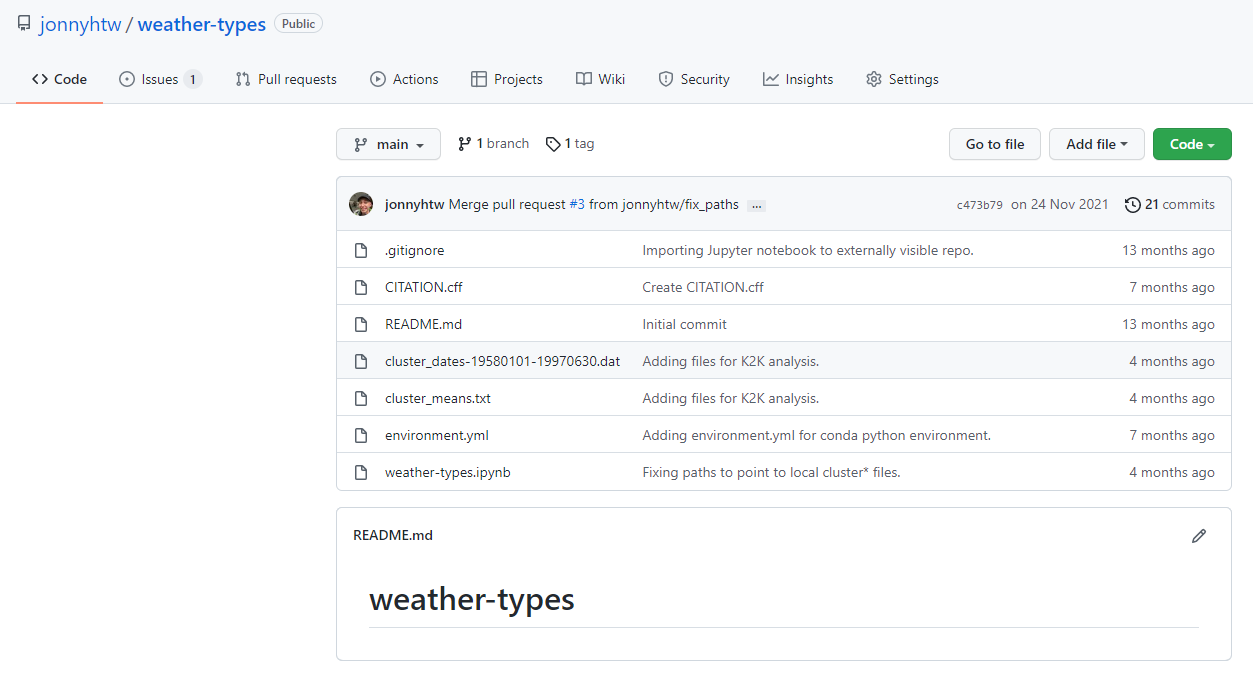 I also included an appendix in the paper which I wrote with James which I hope will be of use to future researchers in this area. I would have saved - I reckon - about a month by having had access to something like this in the first place.  This paper turned into a bit of a labour of frustration at some points but ultimately I hope that I have provided a useful resource for future researchers who want to understand how the types themselves are generated but are stymied by the lack of detailed information on how the types themselves are actually generated. There seemed to be a pervasive assumption that 'everyone knew' how these types were generated whilst at the same time, no-one could actually point me a method of exactly how this was done. Finally, and perhaps most usefully to others, was the suggestion by the peer-reviewers that we should include new weather types from the ERA5 reanalysis, must more up to date and higher resolution than the original NCEP/NCAR one used in K2K, and here they are... 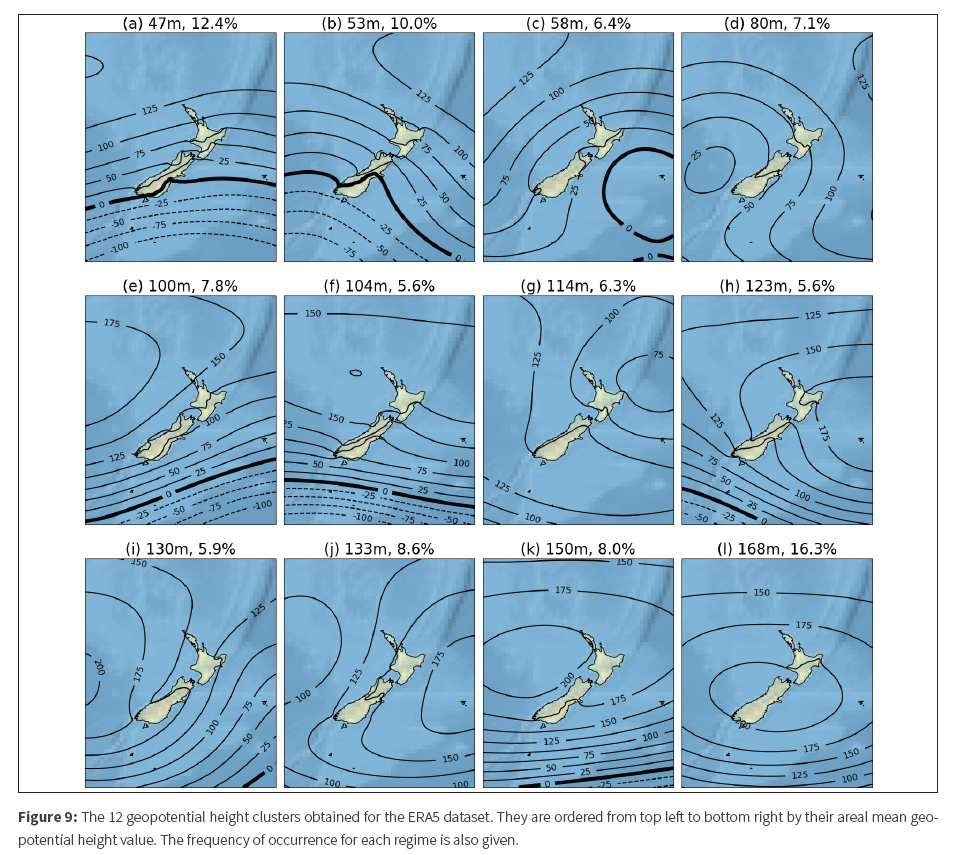
0 Comments
|
AuthorThoughts on weather, climate, software dev, Python, open source and the like. Views are my own. 
Archives
March 2022
Categories
|
 RSS Feed
