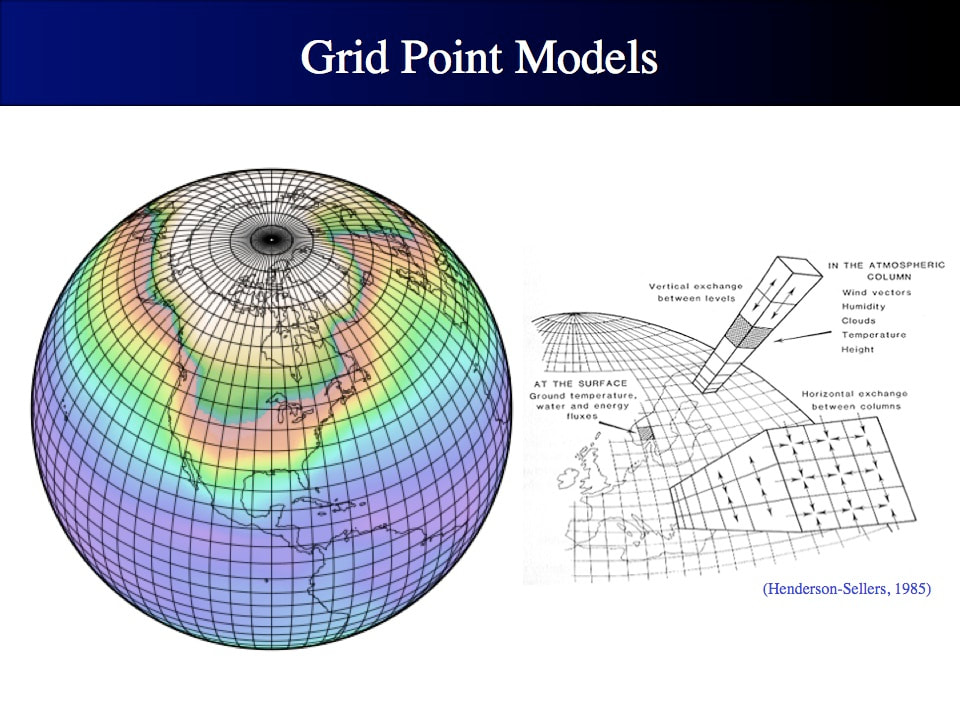
 Many climate and earth system models cover the whole world, including the New Zealand Earth System Model (NZESM). Due to their global scale, the grid scales used by these models tend to be fairly coarse. In the NZESM for example, the atmosphere grid uses the so-called 'N96' scale, which is of the order 100km. This figure shows an example monthly mean near-surface specific humidity for the NZESM. 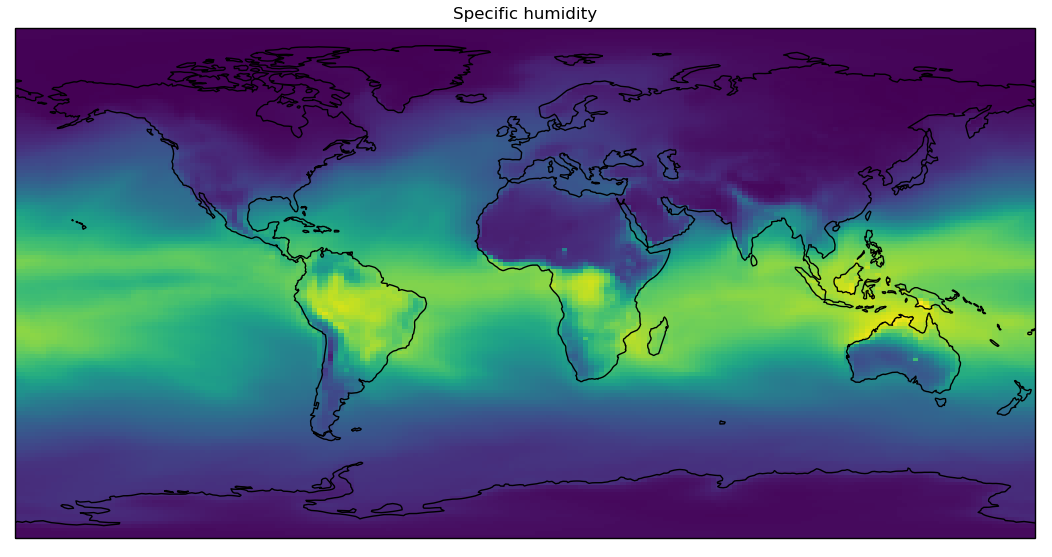 On this global scale, it is not immediately obvious that the grid is fairly coarse so let's look at Aotearoa New Zealand close up... 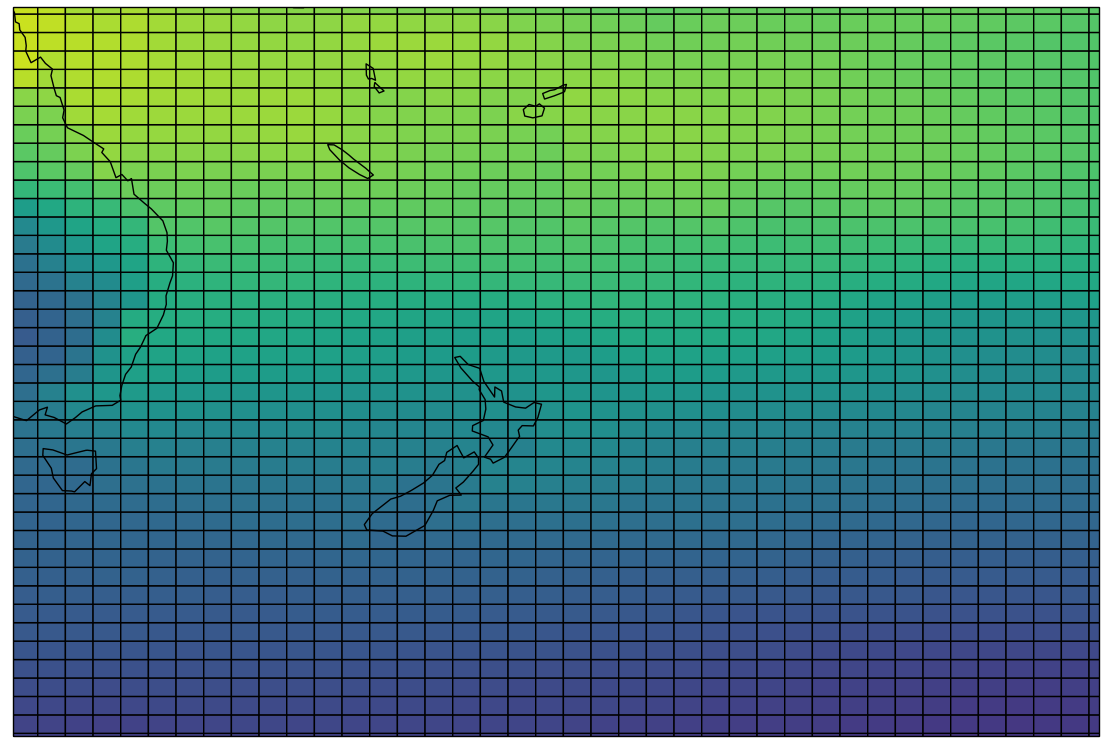 As you can see from this, the gridscale is very roughly the size of a 'region' of the country, like Waikato or Northland; as a rule of thumb. In addition you can't use individual grid boxes for projections! Now one thing which is really great about this coarse grid is that you can include a wide variety of model complexity; this is really the definition of an 'earth system' model as compared to a 'climate' model. The GENIE model has a great figure that represents the level of complexity present in the NZESM nicely... 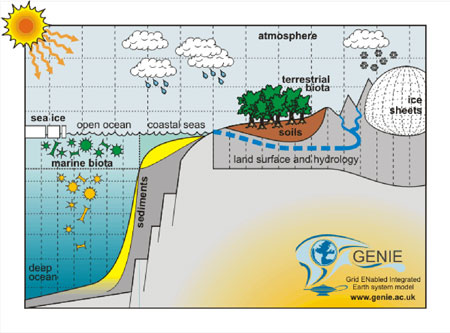 So in summary, in order to get any information on finer scales than individual NZ regions, you need to use a different model. This is exactly the basis of this project within the Deep South National Science Challenge...  You can find out more about this project here. This project involved three inter-related but different models:
Crucially, this modelling chain is, well, exactly that; a chain! The output of the NZESM is fed into the regional atmosphere model, producing data like rainfall intensity at a significantly higher resolution. This higher-resolution atmosphere data can then be fed directly into the hydrological model producing internally-consistent projections at various scales. This figure shows the resolution of the NZRCM (from Stephen Stuart, NIWA). 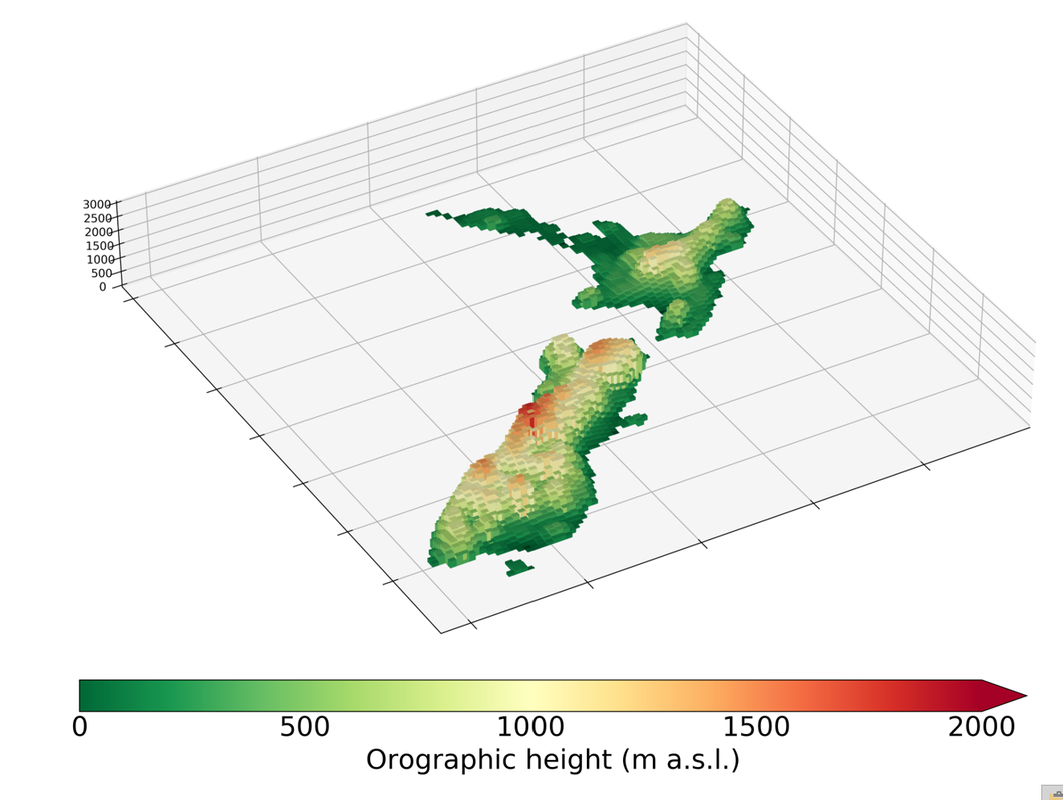 In this depiction of the RCM, the gridscale is much finer, representing features like Rakiura Stewart Island, and the Hauraki Gulf. At the length scales characteristic of the RCM, modellers are able to represent features which are absent in the global model. An example of the features present in the RCM is the Southern Alps.  This huge mountain range spanning the entire South Island greatly influences rainfall, particularly in the West Coast region. Simulations using the RCM forced by data from the global NZESM are being run as I write! What about our river catchments though. Here's a NIWA map of some of the bigger ones... 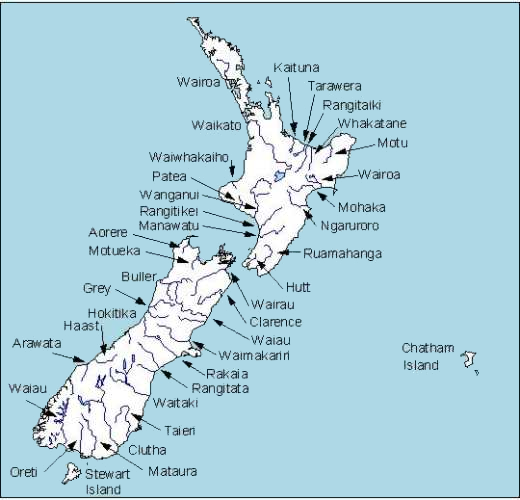 This is just scratching at the surface of the hydrological richness of Aotearoa though. Check out the resolution that the NZ Water Model is capable of giving us (Collins, D. and Zammit, C. Climate change impact on agricultural water resources and flooding. Prepared for the Ministry of Primary Industries. Client Report 2016114CH)! 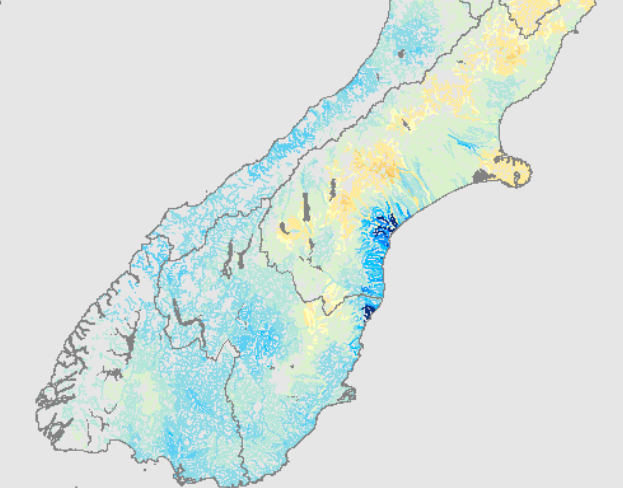 The NZ Water Model will be run using the output from the NZRCM, thus enabling the additional resolution of e.g. mountains to assist in predicting how global climate change will ultimately impact our local climate and hydrology.  This has been a whistle stop tour of the modelling capability that we now have in place!
Keep an eye on our progress at the new and improved Deep South Challenge website.
0 Comments
Leave a Reply. |
AuthorThoughts on weather, climate, software dev, Python, open source and the like. Views are my own. 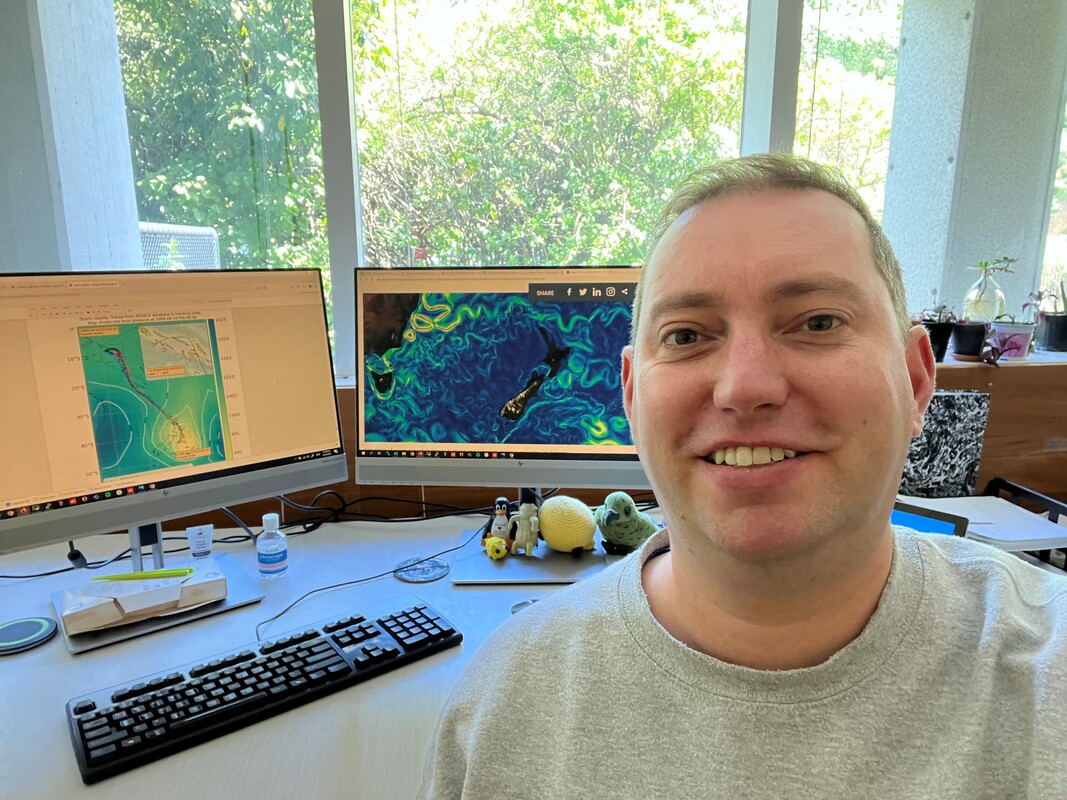
Archives
March 2022
Categories
|
 RSS Feed
